Scatter Plot Matrix in Lattice: A way to join multiple scatter plot matrices in one plot
A best way to understand relationship between quantitative variables is visualizing data with pairwise correlations. Recently, I had to display pairwise correlation of multiple phenotypes with respect genotypes of a variant. Since, 'scatterplotMatrix' function available in 'car' package of R is one stop solution to do that I initially used it. However, I was surprised when I wanted to bring multiple plots on one single plot. Because, below scripts did not create a plot having side by side plot.
library(car)
data1=data[rs3827103=='GG',]
data2=data[rs3827103=='GA',]
par(mfrow=c(1,2));
scatterplotMatrix(~SBP + DBP + Leptin + WC + BMI + Weight | factor(data1$rs3827103), data=data1, diagonal='none', pch=c(18),smoother=FALSE, reg.line=lm)
scatterplotMatrix(~SBP + DBP + Leptin + WC + BMI + Weight | factor(data2$rs3827103), data=data2, diagonal='none', pch=c(18),smoother=FALSE, reg.line=lm)
I finally could find reason for this to behave so and an alternative function to it. The pairs() function used in scatterplotMatrix, resets par(mfrow), so that function fails bring plots side by side. However, splom() function of lattice does pairwise correlations and plots such multiple plots in single plots in much easier way.
library(lattice)
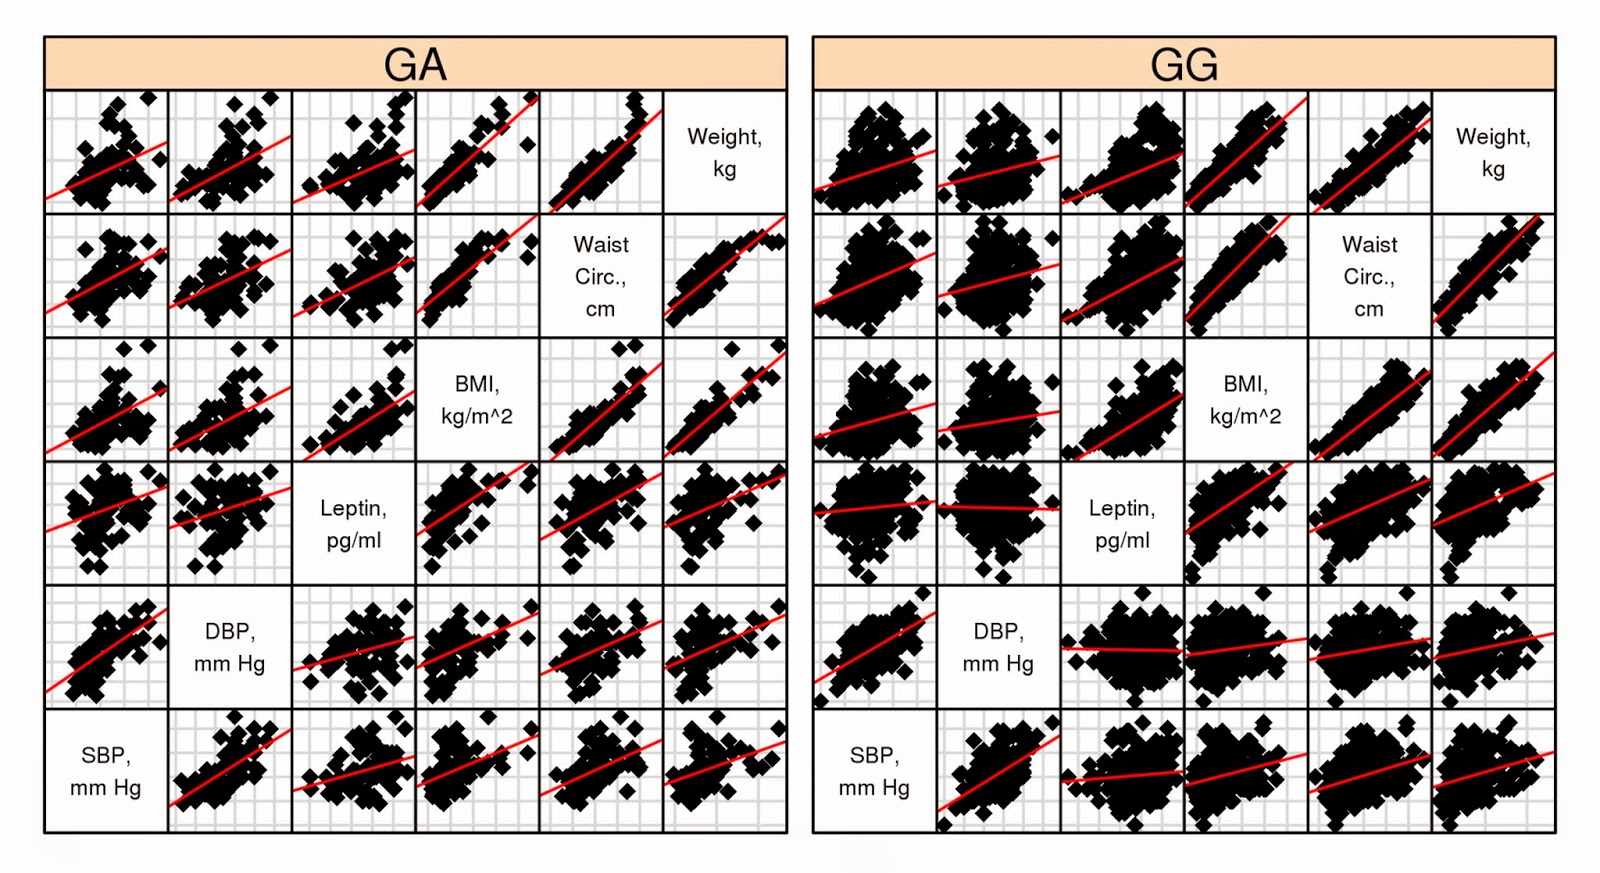
splom(~data.frame(SBP, DBP, Leptin, BMI, WC, Weight) | rs3827103, data=data,layout=c(2,1), pscales=0, varnames=c(),type=c('r', 'g', 'p'), varname.cex=.5, col.line='red', pch=18, col='black', xlab=NULL)
Comments