Scatter Plot Matrix in Lattice: A way to join multiple scatter plot matrices in one plot
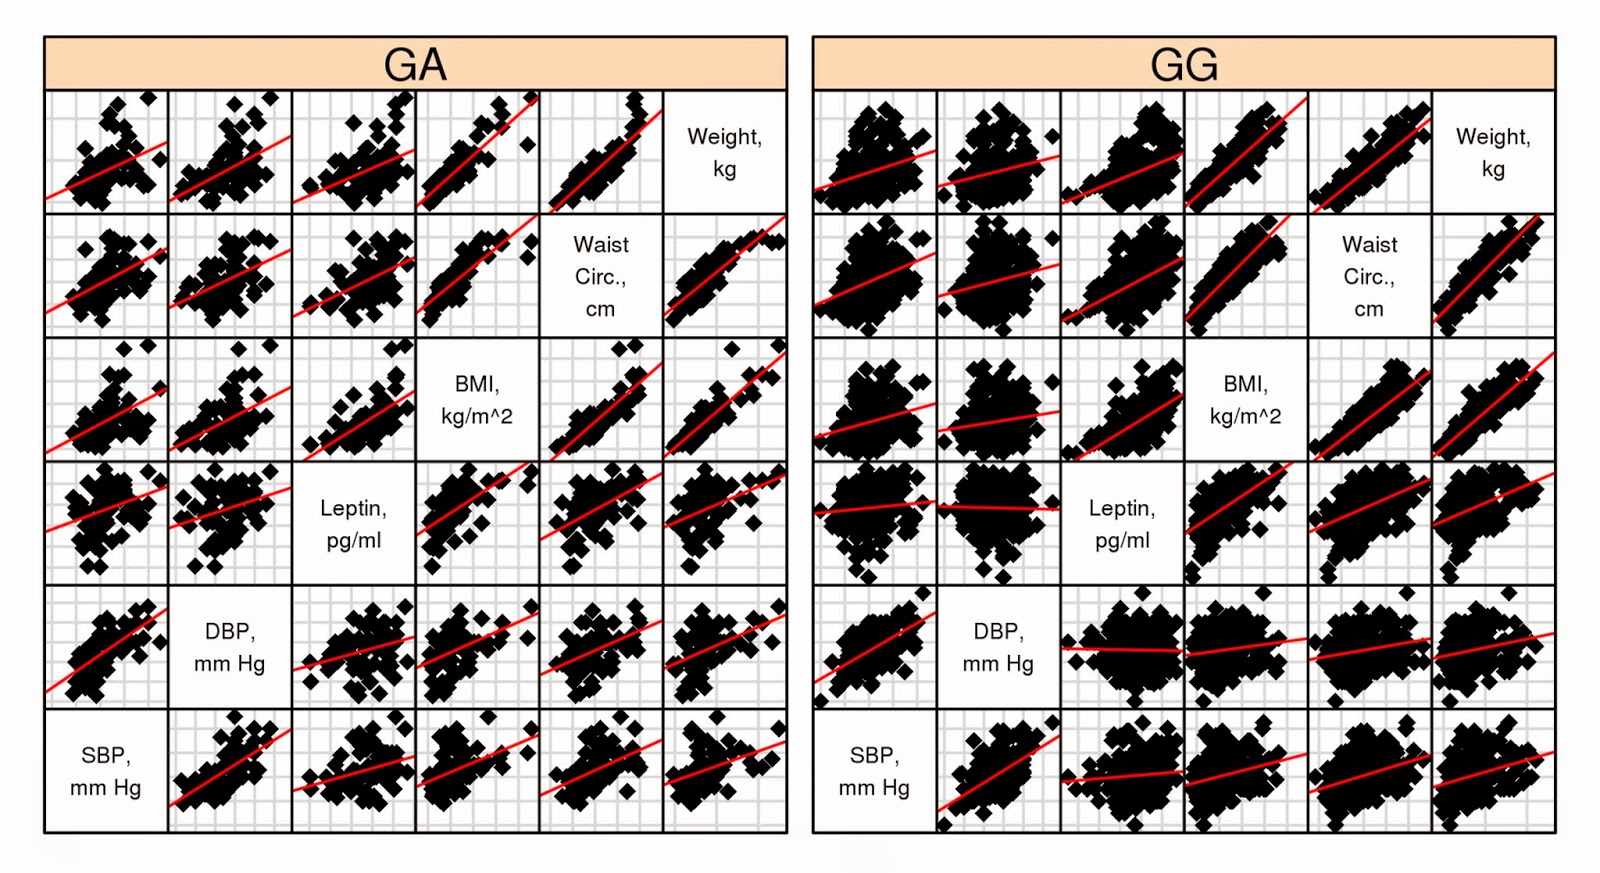
A best way to understand relationship between quantitative variables is visualizing data with pairwise correlations. Recently, I had to display pairwise correlation of multiple phenotypes with respect genotypes of a variant. Since, 'scatterplotMatrix' function available in 'car' package of R is one stop solution to do that I initially used it. However, I was surprised when I wanted to bring multiple plots on one single plot. Because, below scripts did not create a plot having side by side plot. library(car) data1=data[rs3827103=='GG',] data2=data[rs3827103=='GA',] par(mfrow=c(1,2)); scatterplotMatrix(~SBP + DBP + Leptin + WC + BMI + Weight | factor(data1$rs3827103), data=data1, diagonal='none', pch=c(18),smoother=FALSE, reg.line=lm) scatterplotMatrix(~SBP + DBP + Leptin + WC + BMI + Weight | factor(data2$rs3827103), data=data2, diagonal='none', pch=c(18),smoother=FALSE, reg.line=lm) I finally could find reason for this to behave ...