Posts

Unzipping password protected files of Michigan Imputation Server

while unzipping imputation server zip files with 'unzip -P', you may end up in seeing an error; unsupported compression method 99. To solve this, you need to install p7zip-full tool. sudo apt-get install p7zip-full then use 7za x -Pyour_password file_to_be_unzipped.zip Note: 1. if you have any special characters in your password, flag them with \ sign. 2. do not have space between -P and your password

Making gene annotation file to draw regional plots for GWAS, a shell script

for i in {{1..22},"X","Y"} do mysql --user=genome --host=genome-mysql.cse.ucsc.edu -A -D hg18 -e 'select distinct name, chrom, txStart, txEnd,strand, name2, IF(NOT(txEnd<248956422 OR txStart>1),0, IF(txStart>1,txStart-1,248956422-txEnd)) as distance from refGene where chrom="chr'$i'" order by distance' > temp1 sort -u -n -k 3,3 -k 4,4 -s temp1 >temp2 rm -fr temp1 echo "START STOP SIZE STRAND GENE" >"chr"$i"_hg18.txt" awk '{print $3,$4,$4-$3,$5,$6}' temp2 | sed '1d;$d' >> "chr"$i"_hg18.txt" echo "Done with chr$i" rm -fr temp2 done

Dot programming to draw cryptic relationships from GWAS samples

Image
One of the confounding factors in GWAS is genetic relatedness between the samples. PLINK offers utilities to find relatedness and filter samples as per degree of relatedness you wish to exclude for statistical association analysis. As often GWA studies involve larger number of unrelated samples, it becomes very hard to manually draw relationship between the samples, especially when the population in question is highly inbred. In this context one can make use application of DOT programming to draw directed graphs and select unrelated individuals from the cluster of related individuals, quite easily. To do so Get second and fourth column from your PLINK IBD command output filename.genome. awk –F “ ” ‘{print $2,$4}’ FileName.genome > CrypticRel.dot Then insert ‘->’ between the sample ids sed –i ‘%s/\s/->/g’ CrypticRel.dot Then, add following lines to top of the file CrypticRel.dot Diagraph CrypticRelatedness { Graph [splines=true overlap=false center=1]; Node [shape=no

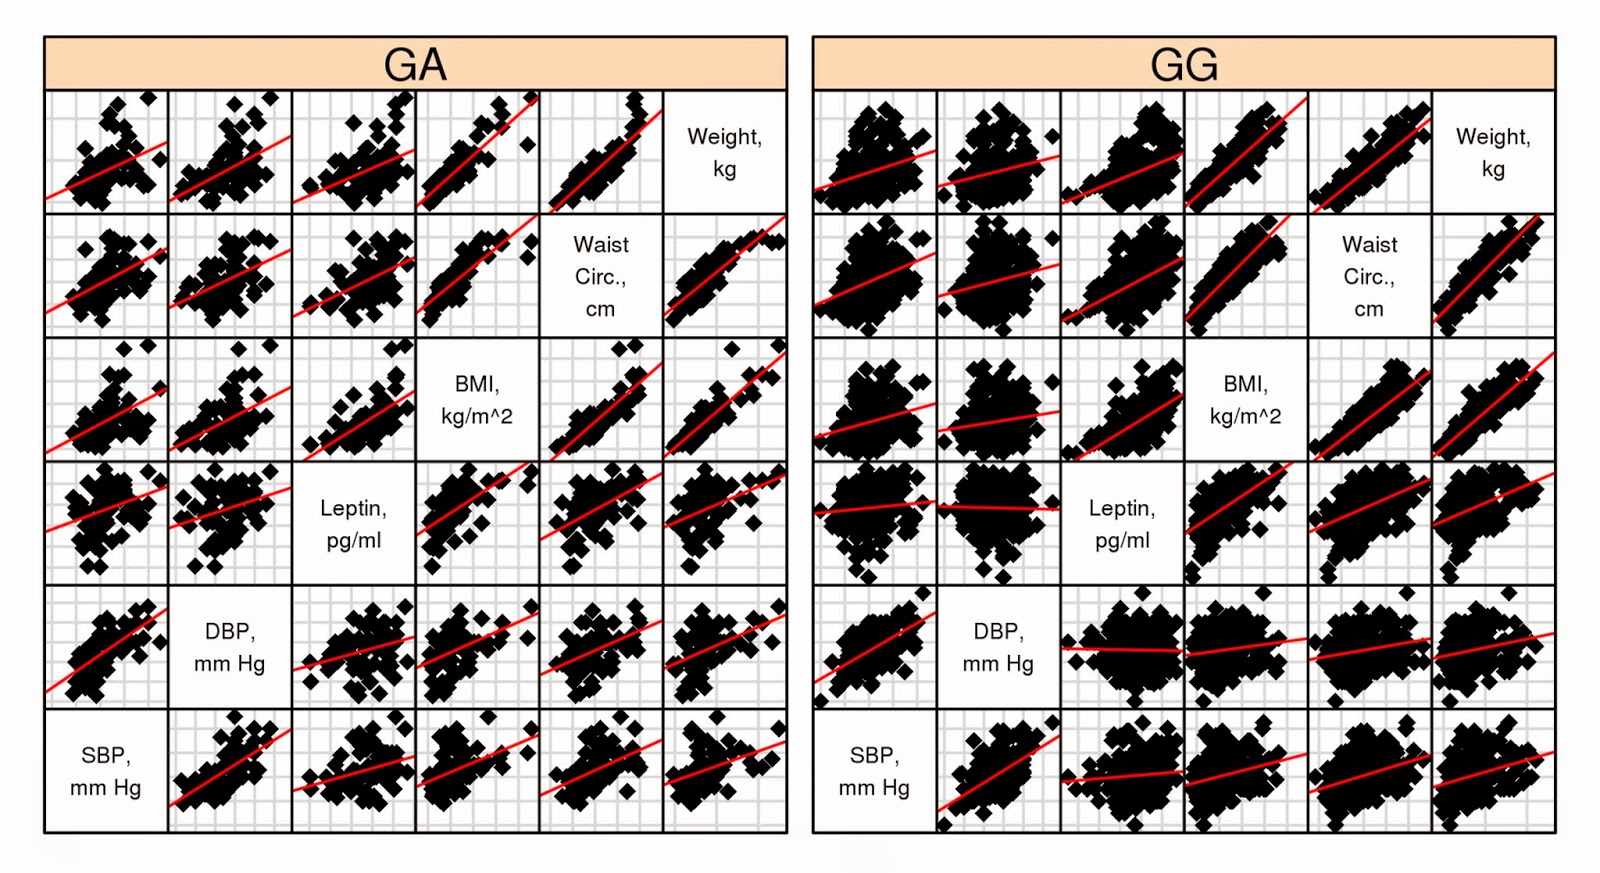
Scatter Plot Matrix in Lattice: A way to join multiple scatter plot matrices in one plot

Image
A best way to understand relationship between quantitative variables is visualizing data with pairwise correlations. Recently, I had to display pairwise correlation of multiple phenotypes with respect genotypes of a variant. Since, 'scatterplotMatrix' function available in 'car' package of R is one stop solution to do that I initially used it. However, I was surprised when I wanted to bring multiple plots on one single plot. Because, below scripts did not create a plot having side by side plot. library(car) data1=data[rs3827103=='GG',] data2=data[rs3827103=='GA',] par(mfrow=c(1,2)); scatterplotMatrix(~SBP + DBP + Leptin + WC + BMI + Weight | factor(data1$rs3827103), data=data1, diagonal='none', pch=c(18),smoother=FALSE, reg.line=lm) scatterplotMatrix(~SBP + DBP + Leptin + WC + BMI + Weight | factor(data2$rs3827103), data=data2, diagonal='none', pch=c(18),smoother=FALSE, reg.line=lm) I finally could find reason for this to behave

Way to mount remote directory in linux and accessing it over apache

Plenty different ways are out there like Samba, NFS or FTP. I tried FUSE which uses SSH protocol. Step 1: Install fuse-ssh in the system where you want to have remote directory. Ubuntu: apt-get install sshfs Redhat: yum install fuse-sshfs.x86_64 Step 2:  Enable password less SSH login Make sure that you have openssh-server and openssh-client in your system. then issue 'ssh-keygen' command. Then copy id_rsa.pub generated to remote systems ~/.ssh/authorized_keys Step 3: In /etc/fuse.conf  enable 'user_allow_other' If you dont do this apache wont be able to access mounted directoy Step 4: Mounting remote directory sshfs -o allow_other, uid=1000, gid=1000, IdentityFile=~/.ssh/authorized_keys root@XXX.XX.X.XX:/var/www/html/JBrowse/data /var/www/data Now you should be able to access data directory over apache. To unmount the directory use: fusermount -u /var/www/data

Who is best with MySQL? R or Perl or Python: A benchmark

I really surprised to see R talks better with MySQL than Perl or Python!!!... I thought R might be slow in querying MySQL database. But I have a different answer here. Following is the code used for this demo. R script: library(RMySQL) test <- function(){          con <- dbConnect("MySQL", host="genome-mysql.cse.ucsc.edu", user ="genome", dbname = "hg18")          rs <- dbGetQuery(con, "select name, chromEnd from snp129 where chrom='chr1' and chromStart between 1 and 1e8;")          return(rs)          dbClearResult(rs)          dbDisconnect(con)         } print(system.time(test()))    user  system elapsed   0.372   0.039  25.729 R took 25.729 seconds to retrieve half million records. Python script: from time import time import MySQLdb start=time() def test():         Conn = MySQLdb.connect(host="genome-mysql.cse.ucsc.edu",user='genome',db="hg18")         Cursor = Conn.cursor()   

CollabNet: a Subversion client for Netbeans

As of now it is hard to find CollabNet debian package. Hence, I went back to traditional way of installing .rpm packages available for CollabNet. A simple guide is presented here for you, Firstly install alien package which converts .rpm packages to .deb sudo apt-get install alien then, download http://downloads-guests.open.collab.net/files/documents/61/921/CollabNetSubversion-client-1.5.1-2.i386.rpm Run, sudo alien --to-deb CollabNetSubversion-client-1.5.1-2.i386.rpm this will convert .rpm to .deb then run, sudo dpkg -i collabnetsubversion-client_1.5.1-2_i386.deb Now, configure Netbeans with SVN. Go to Netbeans > tools > options > set the proxy (check whether you need it or not) Then, tools > options > select Versioning (Subversion) > miscellaneous > provide SVN executable path (often /usr/bin or /usr/local/bin) then, go to Team > Subversion > Check out > Mention SVN repo URL (http://your_repo.org/svn/ProjectName/trunk) Finally, select the check out folde